

Abstract
Plastic pollution of aquatic ecosystems is a growing environmental problem. Most plastic pollution originates from land-based sources and is transported via rivers, where plastic densities can exceed those at sea. Rivers in southeast Asia are regularly identified among those transporting the greatest plastic loads globally, yet are among the least studied major river systems. This is particularly concerning since they provide habitat for commercially, culturally and ecologically important species. We present a four-step risk framework to assess the relative risk to wildlife at different sections of a river, particularly where data may be sparse. We apply this method to a case study in the Ganges and Mekong rivers. The first step is to estimate litter density and abandoned fishing gear (ALDFG) to determine the relative level of pressure from ingestion or entanglement. Step two uses a risk assessment to determine the likelihood of a species interacting with a given item, and the further likelihood of a negative outcome of that encounter. Step three determines the overlap of the habitat of the species with the litter present in the environment, and the final step integrates all of these factors to present an overall relative risk to migratory species within each watershed. In the Ganges and Mekong rivers, entanglement represents the highest risk to species. The methods presented here estimate the relative risk to vertebrate fauna from litter interactions in rivers where empirical data are not available, aiming to determine (i) where in each river do we expect to find the most plastic and ALDFG and (ii) whether species suspected to be threatened by plastic pollution overlap with these predicted high-risk regions. This approach will aid decision-makers to make informed precautionary assessments bridging data gaps about relative plastic loads and associated risks in aquatic systems, until empirical data becomes available.
Export citation and abstract BibTeX RIS

Original content from this work may be used under the terms of the Creative Commons Attribution 4.0 license. Any further distribution of this work must maintain attribution to the author(s) and the title of the work, journal citation and DOI.
1. Introduction
1.1. Plastic litter in aquatic environments
Plastic pollution in aquatic environments is a global environmental issue, with predicted growth in plastic waste exceeding efforts to mitigate this social, economic and environmental hazard (Borrelle et al 2020). In 2016, an estimated 19–23 million metric tons of plastic entered aquatic ecosystems, 11% of all plastic waste generated globally (Borrelle et al 2020). The majority of research on plastic in aquatic environments has been conducted on marine ecosystems (Wendt-Potthoff et al 2020). However, given that most plastic pollution originates from land, and much of it is transported to the ocean via river systems (Lebreton et al 2017, Meijer et al 2021), there is a growing need to better understand not only how much plastic is travelling through these river systems, but also the impacts it has on wildlife and commercially important species.
Several studies have attempted to model the amount of plastic flowing through the world's rivers at a global or regional scale. Much of this work highlights the contribution from rivers in Asia, which have consistently been ranked among those most heavily contributing to aquatic plastic pollution (Schmidt et al 2017, Lebreton et al 2017, Van Calcar and Van Emmerik 2019). While these studies have compared loads between rivers, fewer studies focus on the variability of litter levels along a river and none to date have addressed the potential risk posed by river litter to aquatic vertebrates.
1.2. Plastic litter in the Ganges and Mekong Rivers
The Ganges and Mekong Rivers are ranked 2nd and 11th, respectively, for plastic pollution globally (Lebreton et al 2017). Together these two rivers flow through eight countries where there is great concern for the social, economic and conservation impacts of pollution.
The Ganges basin sprawls across 11 Indian states and has a catchment area of 861 000 km2 (Pandey and Singh 2017). Mismanaged waste from rapidly expanding cities such as Kolkata, and Varanasi flushes into this river system (Sinha and Loganathan 2015). However, the operational sewage treatment capacity is only 33% of the total sewage generated in the basin (Trivedi 2010). A recent expedition along the Ganges estimated that the Ganges, Brahmaputra and Meghna rivers collectively release up to 1–3 billion microplastics into the Bay of Bengal every day (Napper et al 2021).
Far less is known about plastic pollution in the Mekong River. Despite several global studies naming the Mekong as one of the world's most polluted rivers (Lebreton et al 2017, Schmidt et al 2017), there is limited empirical information to support this claim. An estimate of the volume of mismanaged plastic waste in the Tonle Sap basin found that approximately 221 700 tons of plastic entered the basin between 2000 and 2020, and projected that 282 300 ± 8700 tons will enter the basin between 2021 and 2030 (Finnegan and Gouramanis 2021).
High plastic loads can result in significant risks to aquatic wildlife, as the Ganges and Mekong River basins are home to numerous threatened and migratory species (IUCN (International Union For Conservation Of Nature) 2021, Roman et al, 2022). This is particularly concerning as the Mekong River is second only to the Amazon in river biodiversity (Ziv et al 2012).
1.3. Risk to wildlife in the Ganges and Mekong Rivers from plastic litter
While the risks posed by plastic ingestion and entanglement to marine species are well documented, there is less published evidence for the impacts to freshwater species (Gregory 2009, Kühn et al 2015, Kühn and Van Franeker 2020). Generally, the risks from ingestion can be from a myriad of mostly smaller items, with flexible (e.g. plastic bags and soft packaging) and sharp (e.g. fishing hooks) items carrying the highest likelihood of harm (Roman et al 2021). Entanglement is most often associated with abandoned, lost or discarded fishing gear (ALDFG) (Derraik 2002, Gregory 2009).
Here we present a risk assessment framework designed to assess the relative risk to species at various points along a river. We use the Mekong and Ganges Rivers as a case study and assess the risk to migratory species in each of these basins. Specifically, we estimate the relative litter loads and ALDFG densities in each river section, determining which sections are likely to have higher or lower densities of plastic pollution and calculating to what extent the habitats of species at risk from plastic overlap with these predicted high-plastic regions (Schuyler et al 2021b).
2. Materials and methods
To assess the risk to wildlife from plastic, we adopted a four-stage process. First, we split the rivers into sub-sections and identified the relative level of pressure within each section; i.e. the relative litter density to measure ingestion risk and the relative level of ALDFG to measure entanglement risk. Next, we assessed the risk from encountering plastic for each species, based on a risk matrix of likelihood of interaction by severity of outcome. We then quantified the presence of each species within each river section, by calculating the proportion of river section that falls within the species' known habitat. Finally, to calculate an overall risk within each river section, we multiplied the relative pressure by the risk by the habitat overlap and summed across all species (figure 1).
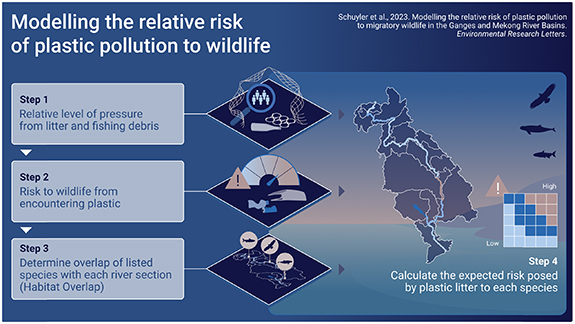
Figure 1. Graphic overview of the methodology for modelling the risk of plastic pollution to wildlife.
Download figure:
Standard image High-resolution image2.1. Step 1: Relative level of pressure from litter and fishing debris
We determined the watershed basins of each river and used these boundaries to divide the rivers into sub-sections (Lehner and Grill 2013, Open Development Cambodia 2019). The Ganges River was split into 6 sections, while the Mekong River was split into 12 sections, with an additional two for the Tongle Sap basin and Tongle Sap River. We determined the pressure from plastic litter and fishing debris within each basin as a relative measure.
2.1.1. Litter load in river sections (relative litter)
Because there are limited data on macro litter within the Ganges and Mekong River basins, and the litter data that do exist are patchy, we predicted relative debris loads along the Ganges and Mekong rivers using a model created from debris data collected as part of CSIRO's global plastics leakage project (Schuyler et al 2021a). For rivers with more empirical data available, litter loads could be measured rather than predicted.
Detailed methods for the modelling used in predictions can be found in (Schuyler et al 2021a), but in brief, field surveys were conducted in both rural and urban areas surrounding 12 different cities in ten countries. These included six countries in Asia: Bangladesh, China, South Korea, Sri Lanka, Taiwan and Vietnam, and four outside of Asia: Kenya, Peru, Seychelles and South Africa. At each of a total of 395 sites, 3–6 transects of 25 m2 each were surveyed. These surveys quantify litter items in a visible size range only and therefore the modelled outputs do not cover microplastics (Schuyler et al 2018).
A number of globally available covariates have been demonstrated to be useful in explaining the variability in the observed data. These include population density (Center for International Earth Science Information Network 2018), nightlights (Earth Observation Group 2020), human development index (HDI) and gross domestic product (Kummu et al 2018), distance to the nearest road (Center For International Earth Science Information Network—Columbia University 2013), distance to the nearest river (Lehner and Grill 2013), landcover (Sulla-Menashe et al 2019) and landuse (Ellis and Ramankutty 2008). We also used a subnational estimate of mismanaged waste (Lebreton and Andrady 2019). We assessed the contribution of these covariates to the total litter load with generalised additive models and compared the Akaike information criterion (AIC) scores for each possible combination of covariates. To get the best fit model, we carried out model averaging on all models that were within 3 AIC scores of the top model. When selecting models, we avoided collinearity by ensuring that no one model could include variables that scored higher than 0.6 using Pearson's correlation test.
We used the best-fit model to predict litter densities at each vertex of a 5 km grid across each river basin. The debris density was presumed to be uniform across the entire 5 km square, and was summed within each watershed to determine a relative litter density for each river section. In order to account for downstream flow, we presumed that once litter had reached the river from the watershed, it would have a 30% transmission rate, meaning that 70% of the litter would be retained within each section of the river, while the rest would be available to move downstream. Retention rates can vary with the type of plastic and the surrounding habitat (Ivar Do Sul et al 2014), and items can be retained in areas such as mangrove forests for years. The retention rate we selected is arbitrary, but reflects the assumption that debris loads are related more to transport from the watershed than from upstream areas, though certainly some downstream transport occurs. Thus the relative litter loads in the most upstream reaches are comprised solely of debris coming from the watershed, while for downstream reaches, there is increasingly more contribution from upstream sectors. For more details on the modelling, see S1.
2.1.2. ALDFG load in river sections (relative ALDFG)
We used the best available data to estimate the relative level of pressure from ALDFG. For the Ganges River, a recent study measured and ranked ALDFG at nine sites (Nelms et al 2021). We ranked these observations and took the average rank of the observations falling within each river section. From these numbers, we calculated a relative ALDFG metric for each section of the river.
For the Mekong River, we had no data on ALDFG density or on fishing effort, so we used the number of people living within 10 km of the riverbank to serve as a proxy measure of local fishing effort. We calculated the total population along each section of the river, and scaled from 0 to 1, with 1 being the most densely populated section of the river. We presumed that people lost fishing gear proportionate to the amount of fishing that took place, which we assumed was proportionate to the population within each section of river.
2.2. Step 2: Risk to wildlife from encountering plastic
The next step is to estimate the risk to wildlife that results from encounters with plastic. This could be based on published studies of observed ingestion and entanglement rates, but because there is very little empirical data for aquatic species in these rivers, we based our risk estimates on an extensive literature review of litter encounters of related species (see Roman et al 2022 for a detailed explanation of the risk assessment methodology). In short, the Convention on the Conservation of Migratory Species of Wild Animals (CMS) listed species that occur in the Ganges and Mekong River basins were assigned a likelihood of interaction with plastic. This interaction score was based first on published evidence of encounters, and in the absence of such evidence, behavioural and ecological factors such as foraging behaviour, diet and habitat. The species were compared to other species with similar behaviours and foraging strategies, to determine how likely they were to interact with plastic, given their behaviours, habitat, and prey. The species were also coded on their risk of adverse impact if they did interact with plastic. Risk scores were based first on published evidence for the species of interest, and secondarily on evidence from related species. Both measures were scored with values from 1 to 4. These scores were multiplied for a final risk score for interaction with plastic pollution of 1–16, with the scores distributed from negligible risk (score 1–3), low risk (score 4–6), medium risk (score 8–9) and high risk (scores 12–16). For a full description of the literature review and scorings for each species, see Roman et al (2022).
2.3. Step 3. Determine overlap of listed species with each river section (Habitat Overlap)
The highest quality (and most conservative) species distribution maps available for the region are the shapefiles provided by the International Union for Conservation of Nature (IUCN (International Union For Conservation Of Nature) 2021). IUCN species distribution maps were not available for the Ganges River dolphin, so we used distribution maps compiled by the Wildlife Institute of India (WII-GACMC 2018). We assessed the proportion of each section of the river which overlapped with the habitat for each species.
2.4. Step 4. Calculate the expected risk posed by plastic litter to each species
To determine the relative risk from ingestion or entanglement to each species at each section of the river, we multiplied the risk score (behaviour score * impact score) by the relative pressure from either plastic litter (ingestion risk) or ALDFG (entanglement risk). We assessed the relative cumulative risk to species for each section of the river by multiplying the risk score for each species by the proportion of the river section that each species inhabits, and adding the total scores.
For each species:
Relative Ingestion Risk (per species) = Risk Score * Relative litter density
Relative Entanglement Risk (per species) = Risk Score * Relative ALDFG density
Overall:
Overall ingestion risk per river section = sum (Risk Score * Relative litter density * Habitat Overlap)
Overall entanglement risk per river section = sum (Risk Score * Relative ALDFG density * Habitat Overlap)
Note that the maximum possible risk score for an individual species would be for a species that has a high probability of interacting with litter, with a lethal outcome, living in the section of the river with the highest quantity of plastic litter or ALDFG. It is important to note that this highest level of risk is relative, and comparable across river sections. Without quantitative data on the actual volumes of litter or ALDFG encountered at each river section, or on the mortality expected from these interactions, we cannot provide an absolute estimate of the risk of mortality within the river basins.
3. Results
3.1. Relative level of pressure from litter and fishing debris
3.1.1. Ganges River
Significant terms from the debris modelling included HDI, several land uses (rice villages, residential irrigated cropland), population density, mismanaged waste, value of the built environment, and the residuals between nightlights and population density (table S1).
Using the best fit models, the median value of the predicted litter distributions in the Ganges was 0.43 items m−2 (min 0.003 72–77.706 46). Predicted litter loads were highest at the two sections of the river closest to the mouth, with the highest load in the lower extent of Basin 5, in Bihar, India and north-west Bangladesh, followed by Basin 6, which runs through Bangladesh and into the Bay of Bengal (figure 2(b)).

Figure 2. (a) Predicted litter density in inland areas for Ganges River Basin (Reproduced with permission from Schuyler et al (2021b), the CMS Secretariat and the Government of Japan as donor of the project). (b) Relative litter densities for each of 6 sections of the Ganges River. Note that these values do not represent a predicted litter density that would be within each section; rather they represent the litter density that we would expect within each section relative to the other sections (Reproduced with permission from Schuyler et al (2021b), the CMS Secretariat and the Government of Japan as donor of the project). (c) Relative ALDFG levels at sections along the Ganges River, using observed ranked densities of ALDFG (Nelms et al 2021).
Download figure:
Standard image High-resolution imageSimilarly, the highest ranked section for ALDFG was Basin 6, closest to the mouth of the Ganges River in the south of Bangladesh (Nelms et al 2021) (figure 2(c)).
3.1.2. Mekong River
Out of the full suite of covariates that we tested in our models, HDI, mismanaged waste, mean nightlights, certain landcovers, and the distance to the nearest road were statistically significant in the best fit model for the Mekong (table S2). Gross domestic product (GDP), population density, distance to the nearest river, and nightlights within 1 km were not statistically significant, but including them lowered the AIC score, so we incorporated them into the final model. The other covariates that we tested did not appear in the best-fit model.
The median litter density predicted for points in the Mekong River basin was 0.32 items per m2 (min 0.004, max 6.28). Predicted debris densities were highest in the three sections of the river closest to the river mouth, with Basin 10, in southern Laos, having the highest relative debris overall, followed by the downstream Basin 11, which runs through central Cambodia before joining with the Tongle Sap River, and Basin 12 which extends from Phnom Penh, Cambodia, through southern Vietnam to the South China Sea (figure 3(b)). Predicted ALDFG levels were also highest in Basin 10, but then lower in the two downstream river sections passing through Cambodia and Vietnam.
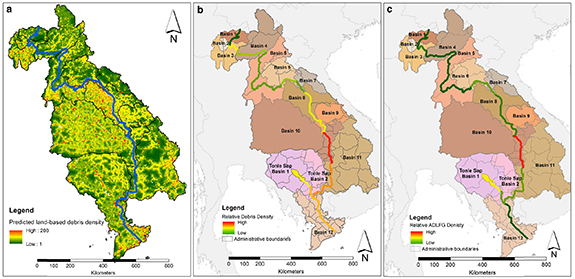
Figure 3. (a) Predicted litter density in inland areas of Lower Mekong Basin watersheds (Reproduced with permission from Schuyler et al (2021b), the CMS Secretariat and the Government of Japan as donor of the project). (b) Relative litter densities for each of 12 sections of the Mekong River, and two sections of the Tonle Sap lake and river. Note that these values do not represent a predicted litter density that would be within each section; rather they represent the litter density that we would expect within each section relative to the other sections. The highest value of any of the basins is scored at 1, with the other basins relative to that. (Reproduced with permission from Schuyler et al (2021b), the CMS Secretariat and the Government of Japan as donor of the project). (c) Relative ALDFG at sections along the Mekong River, using a proxy of population density within 10 km of the river (Reproduced with permission from Schuyler et al (2021b), the CMS Secretariat and the Government of Japan as donor of the project).
Download figure:
Standard image High-resolution image3.2. Risk assessment
Risk from litter was uneven among species. Overall, Roman et al (2022) estimated that ingestion interactions would be more frequent than entanglement interactions, but entanglement was more likely to be potentially lethal or lethal (table 1). For the Ganges, three species were considered at high or moderate risk from plastic interactions: the Ganges River dolphin (high risk from entanglement, moderate risk from ingestion), the gharial (high risk from entanglement), and the greater spotted eagle (moderate risk from entanglement). In the Mekong River, three species were considered at high or moderate risk from entanglement with litter: the Mekong catfish, the Irrawaddy dolphin, and the Eastern Imperial Eagle. The Irrawaddy dolphin is also at moderate risk from ingestion (table 1).
Table 1. Risk scores for litter interactions in Ganges River and Mekong River CMS listed species, where risk score is either High or Moderate. Reprinted from Roman et al (2022), Copyright (2022), with permission from Elsevier.
| Plastic litter ingestion | Fishing debris entanglement | |||||
|---|---|---|---|---|---|---|
| Species | Interaction | Impact | Risk score | Interaction | Impact | Risk score |
| Ganges River | ||||||
| Ganges River Dolphin (Platanista gangetica) | 3 | 3 | 9 Moderate | 3 | 4 | 12 High |
| Gharial (Gavialis gangeticus) | 2 | 1 | 2 Negligible | 4 | 4 | 16 High |
| Greater Spotted Eagle (Clanga clanga) | 2 | 3 | 6 Low | 3 | 3 | 9 Moderate |
| Mekong River | ||||||
| Eastern Imperial Eagle (Aquila heliac) | 2 | 3 | 6 Low | 3 | 3 | 9 Moderate |
| Mekong catfish (Pangasianodon gigas) | 3 | 2 | 6 Low | 4 | 4 | 16 High |
| Irrawaddy dolphin (Orcaella brevirostris) | 3 | 3 | 9 Moderate | 3 | 4 | 12 High |
3.2.1. Ganges River CMS species cumulative risk
The cumulative risk to CMS-listed species from ingesting litter is highest in Basin 5 (Bihar, India and north-west Bangladesh), but is overall significantly lower than the risk from entanglement in fishing debris (figure 4). Note that the risk is scaled to the maximum cumulative risk for any section of the river, across both ingestion and entanglement to provide a comparative risk score. The cumulative risk to wildlife from entanglement is medium to high for all sections of the river except for the upper reaches, in Basin 1. For the Ganges River dolphin, we predict the highest risk of debris ingestion (medium) occurs in Basin 5, while the highest risk of entanglement occurs in Basin 6, where the Ganges River meets the Bay of Bengal in Bangladesh. For the gharial, we do not consider there to be any significant risk of entanglement due to lack of overlap between Gharial habitat and regions of fishing pressure. Maps for individual species can be found in the SI.
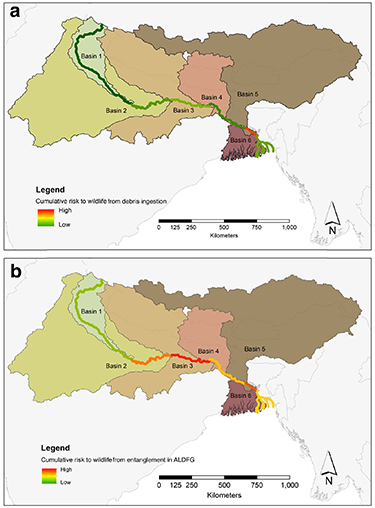
Figure 4. The relative cumulative risk to wildlife in the Ganges River Basin from (a) the ingestion of plastic/plastic litter items (Reproduced with permission from Schuyler et al (2021b), the CMS Secretariat and the Government of Japan as donor of the project) and (b) entanglement in ALDFG (Reproduced with permission from Schuyler et al (2021b) the CMS Secretariat and the Government of Japan as donor of the project).
Download figure:
Standard image High-resolution image3.2.2. Mekong River CMS species cumulative risk
The cumulative risk to CMS-listed species from ingesting litter in the Mekong is mostly low, except in Basin 10, near the border region of Cambodia and Laos, where it is medium. Similarly, the risk from entanglement in fishing debris is high in Basin 10, and medium in the Tongle Sap basin (figure 5). For the Irrawaddy dolphin, we predict that the highest risk from plastic ingestion (rated medium risk) and entanglement (medium-high risk) occurs in the southern extent of Basin 10. For entanglement, we predict that the highest risk to both the Mekong Catfish (high risk) and Eastern Imperial Eagle (medium risk) occurs throughout Basin 10, in southern Laos. Maps for individual species can be found in the SI.

Figure 5. The relative cumulative risk to wildlife in the Mekong River Basin from (a) the ingestion of plastic/plastic litter items (Reproduced with permission from Schuyler et al (2021b), the CMS Secretariat and the Government of Japan as donor of the project) and (b) entanglement in ALDFG (Reproduced with permission from Schuyler et al (2021b), the CMS Secretariat and the Government of Japan as donor of the project).
Download figure:
Standard image High-resolution image
4. Discussion
Missing empirical information about litter in aquatic environments hampers informed decision-making to address this environmental problem, particularly in developing countries that heavily rely on the social, economic and ecological services that rivers provide. Here we have demonstrated a four-step approach that uses the best available data to advise decision makers where plastic pollution is most likely to occur within two major river systems in South and South-East Asia, and where it will have the most impact on vulnerable species. These steps include estimating the debris load, determining the risk from that debris to each individual species, determining the overlap of species with the presence of debris, and finally calculating the overall risk. In this case study in the Mekong and Ganges rivers, we present a methodological stop-gap until empirical data becomes available.
Through this approach, we have identified a limited number of sections in these rivers where species are likely to benefit most from plastic pollution reduction initiatives, for both ingestion risk and the risk of entanglement due to lost fishing gear. By evaluating the risk by river section, it is possible to identify which sections have relatively higher and lower risks, both on an individual species basis, as well as overall (figures 4 and 5, supplemental info). For conservation of the Ganges River dolphin in the Ganges River, interventions focused on Bihar, India and north-west Bangladesh (Basin 5), and downstream through Bangladesh and into the Bay of Bengal (Basin 6) would likely yield the greatest conservation benefit. For wildlife conservation in the Mekong, a focus on interventions in southern Laos (Basin 10), addressing both reduction of plastic pollution and ALDFG, would yield benefits to Irrawaddy Dolphin, Mekong Catfish and Eastern Imperial Eagle, and would likely further deliver downstream benefits in Basins 11 and 12, also identified as higher risk for these species. Across all species, entanglement from fishing gear poses the greater risk. Fishing is a major activity in both river basins. As many as two-thirds of residents in the Mekong River basin rely on subsistence fisheries for survival (Ziv et al 2012), and in the Ganges delta region, 60% of protein consumption comes from fish (Lauria et al 2018). Since ALDFG represents a potentially highly significant source of risk to aquatic species, interventions to reduce ALDFG would likely provide the larger conservation benefit.
The results from this risk assessment can be used to target and prioritise actions for protecting wildlife from plastic pollution and fishing debris in any riverine systems. In this instance, we focused specifically on CMS-listed migratory species, but as the approach integrates a range of factors, managers can tailor the approach to suit their needs. It can incorporate only a small number of species, or can be applied to understand overall risks across a broader spectrum of species.
A similar approach to determine the probability of plastic ingestion by small pelagic fish was applied in the Mediterranean Sea (Fabri-Ruiz et al 2023). Predictions of plastic:zooplankton ratios based on empirical and environmental data were overlaid with fish habitat maps to determine areas of high risk. However, this approach did not take into account differences between species in feeding methodology or life history stage; nor did it integrate differential threats to multiple species. Similarly, Darmon et al (2017) assessed risk in the Mediterranean to two different species of sea turtles by overlapping their habitat with the distribution of debris, but again did not take into account the differential potential for debris interaction from the two species.
The risk assessment approach presented here is a step-wise method of assessing risks from plastic that can be applied to other freshwater or marine habitats. The method emphasises the importance not just of exposure to a stressor; in this case, marine debris or ALDFG, but also the risk of an adverse outcome resulting from wildlife interacting with that stressor. There is also capacity to incorporate differential risks to multiple species within the area, leading to a cumulative risk assessment.
One benefit of this approach is that it is specifically designed to incorporate a range of different data types and availability. There are currently limited data available on plastic distribution and wildlife impacts for the Ganges and Mekong rivers, but the framework can incorporate updated information as it is gathered, which can improve the accuracy and resolution of the risk assessment. Applying this method to other major river systems around the world, including Africa and the Americas, will help us to improve our understanding of risk to all aquatic species. We suggest a range of potential data and analyses that could enhance these analyses for other applications where data may be more widely available (S2).
5. Conclusion
Globally, regions with the highest estimated plastic debris loads often coincide with low levels of empirical data, high species diversity, and human populations that depend on aquatic species for survival (e.g. Ziv 2012). The risk assessment approach outlined here can be applied to estimate the relative risk to aquatic species from ingestion of plastic items and entanglement in ALDFG, even in areas of data paucity. This provides a guideline for managers to prioritise conservation and intervention activities for the maximum benefit to species of concern.
Acknowledgments
This project was funded by the United Nations Environment Programme CMS Secretariat, the government of Japan, and CSIRO. The authors are grateful for the input provided by the Mekong River Commission. We would like to acknowledge the constructive input of Kakuko Nagatani-Yoshida, Makoto Tsukiji, Reynaldo Molina, and Reuben Gergan. Figure 1 was designed by Stacey McCormack (Visual Knowledge).
Data availability statement
The data that support the findings of this study are available upon reasonable request from the authors.
Supplementary data Details on litter modeling, recommendations for future improvements(0.1 MB DOCX)
Supplementary maps Risk maps for individual species (2.7 MB PDF)